股票K线图那条起起伏伏的线,牵动着无数人的心跳——涨了开心,跌了心慌。
雅思折线图也是同样的道理:一条线,讲述一段时间内的故事。
🎯 本章学习目标
📊 折线图长什么样?
✍️ 四段式万能结构
Loading Visualization...
📝 第一段:引言段写法
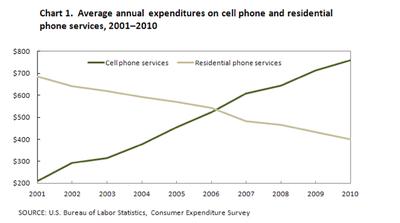
Simon范文示范
引言段万能模板
📝 第二段:概括段写法
概括段公式
It is clear that + 最显著趋势/特征
Also/Furthermore, + 第二个重要特征(可选)
Simon范文示范
概括段常用开头
| 开头方式 | 例句 |
|---|---|
| It is clear that... | It is clear that A increased while B decreased. |
| Overall... | Overall, A showed an upward trend. |
| It is noticeable that... | It is noticeable that A was the highest throughout. |
| Looking at the overview... | Looking at the overview, A dominated the chart. |
📝 第三段+第四段:细节段写法
Simon范文示范
🔍 趋势分析:找关键点
六大关键点
| 关键点 | 含义 | Simon表达方式 |
|---|---|---|
| 起点 | 起始数值 | In 2001, the figure stood at... |
| 终点 | 结束数值 | By 2010, it had reached... |
| 峰值 | 最高点 | peaked at / reached a high of |
| 谷底 | 最低点 | bottomed out at / fell to a low of |
| 交叉点 | 两线相交 | overtook / surpassed / exceeded |
| 转折点 | 趋势改变 | before declining / then rose |
Simon如何描述关键点
🎨 多线条组织策略
2条线:按时间分段
概括段:两条线的总体趋势 + 交叉点
细节段1:前半段时间(两条线的变化)
细节段2:后半段时间(两条线的变化)
3-4条线:按相似趋势分组
线条太多怎么办?
📖 完整范文解析
⚠️ 时态注意事项
📝 实战练习
🔖 折线图高分表达速查
趋势描述
| 趋势 | 基础表达 | 高分替换 |
|---|---|---|
| 上升 | increased | rose / grew / climbed / soared |
| 下降 | decreased | fell / dropped / declined / plummeted |
| 波动 | changed | fluctuated / varied / oscillated |
| 持平 | stayed the same | remained stable / leveled off |
时间连接
| 中文 | 英文表达 |
|---|---|
| 从2001到2010年 | from 2001 to 2010 / between 2001 and 2010 |
| 在接下来的五年 | over the following five years |
| 在同一时期 | during the same period |
| 随后 | subsequently / thereafter |
| 到2010年 | by 2010 |
关键点描述
| 关键点 | Simon表达 |
|---|---|
| 峰值 | reached a peak at / peaked at |
| 谷底 | bottomed out at / fell to a low of |
| 交叉点 | overtook / surpassed / marks the point at which |
| 起点 | stood at / started at |
| 终点 | had reached / had fallen to |